forum
library
tutorial
contact

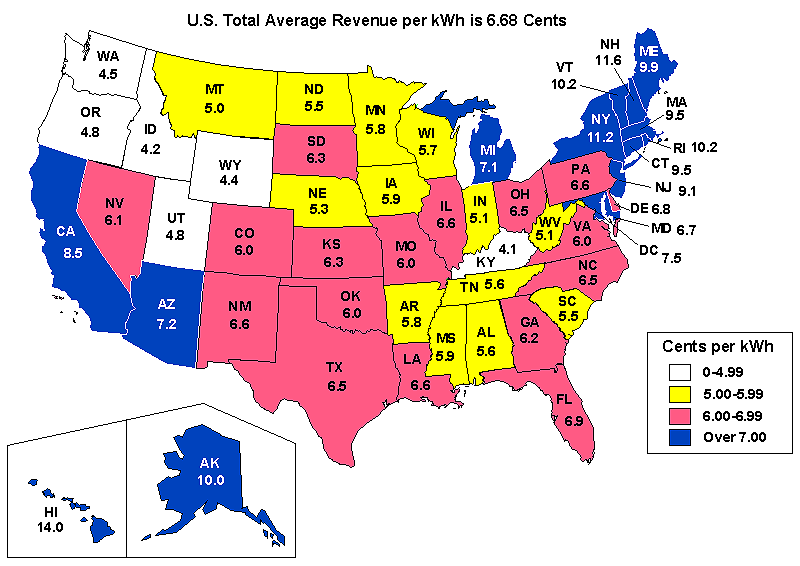
Average Monthly Bill by Sector,
Census Division and State,
1999 Industrial
by Energy Information AdministrationForm EIA-861, "Annual Electric Utility Report", 1999
|
the film forum library tutorial contact |
|
Average Monthly Bill by Sector,
by Energy Information Administration |
| Census Division State | Number of Consumers | Average Monthly Consumption (kWh) | Average Revenue (cents per kilowatthour) | Average Monthly Bill (dollars and cents) |
|---|---|---|---|---|
| Pacific Contiguous | 71,890 | 113,341 | 5.08 | 5,759.38 |
| California | 40,654 | 101,660 | 7.16 | 7,280.72 |
| Oregon | 11,850 | 95,348 | 3.55 | 3,380.34 |
| Washington | 19,386 | 148,835 | 2.70 | 4,023.26 |
| New England | 28,703 | 73,066 | 7.53 | 5,502.63 |
| Connecticut | 5,916 | 82,200 | 7.42 | 6,101.63 |
| Maine | 2,676 | 145,945 | 6.42 | 9,373.38 |
| Massachusetts | 13,871 | 56,528 | 7.75 | 4,381.41 |
| New Hampshire | 3,302 | 63,358 | 9.21 | 5,833.84 |
| Rhode Island | 2,498 | 37,942 | 7.39 | 2,802.64 |
| Vermont | 440 | 300,653 | 7.35 | 22,097.16 |
| Middle Atlantic | 45,497 | 122,997 | 5.53 | 6,806.15 |
| New Jersey | 13,060 | 83,404 | 7.69 | 6,413.17 |
| New York | 8,536 | 246,037 | 4.77 | 11,739.97 |
| Pennsylvania | 23,901 | 100,688 | 5.22 | 5,258.81 |
| East North Central | 72,571 | 259,066 | 4.43 | 11,483.13 |
| Illinois | 5,390 | 643,356 | 5.02 | 32,278.23 |
| Indiana | 18,309 | 214,968 | 3.89 | 8,372.87 |
| Michigan | 13,515 | 226,961 | 5.05 | 11,467.22 |
| Ohio | 29,990 | 206,438 | 4.33 | 8,929.88 |
| Wisconsin | 5,367 | 398,495 | 3.89 | 15,516.52 |
| West North Central | 50,573 | 135,851 | 4.28 | 5,814.79 |
| Iowa | 3,971 | 346,240 | 3.89 | 13,478.47 |
| Kansas | 13,781 | 61,767 | 4.47 | 2,763.81 |
| Minnesota | 11,067 | 209,063 | 4.56 | 9,538.12 |
| Missouri | 9,590 | 140,092 | 4.38 | 6,139.95 |
| Nebraska | 8,421 | 68,118 | 3.57 | 2,433.83 |
| North Dakota | 1,859 | 135,042 | 4.04 | 5,451.00 |
| South Dakota | 1,884 | 86,207 | 4.55 | 3,923.04 |
| South Atlantic | 76,681 | 179,593 | 4.18 | 7,509.82 |
| Delaware | 551 | 538,317 | 4.73 | 25,472.47 |
| District of Columbia | 1 | 20,766,750 | 4.59 | 953,250.00 |
| Florida | 23,353 | 66,298 | 4.77 | 3,160.91 |
| Georgia | 10,987 | 267,401 | 4.15 | 11,097.56 |
| Maryland | 7,633 | 108,478 | 4.26 | 4,622.12 |
| North Carolina | 12,771 | 222,933 | 4.57 | 10,181.84 |
| South Carolina | 4,900 | 546,206 | 3.72 | 20,341.14 |
| Virginia | 5,284 | 319,662 | 3.84 | 12,276.87 |
| West Virginia | 11,201 | 82,778 | 3.80 | 3,148.89 |
| East South Central | 19,523 | 519,966 | 3.67 | 19,063.72 |
| Alabama | 6,378 | 451,199 | 3.82 | 17,243.40 |
| Kentucky | 6,883 | 484,941 | 2.99 | 14,478.89 |
| Mississippi | 4,504 | 291,133 | 4.02 | 11,690.20 |
| Tennessee | 1,758 | 1,492,853 | 4.19 | 62,509.53 |
| West South Central | 121,955 | 110,133 | 4.01 | 4,419.49 |
| Arkansas | 25,771 | 53,936 | 4.12 | 2,224.41 |
| Louisiana | 15,419 | 170,158 | 4.25 | 7,229.82 |
| Oklahoma | 15,334 | 72,122 | 3.60 | 2,599.08 |
| Texas | 65,431 | 127,031 | 3.97 | 5,048.41 |
| Mountain | 38,802 | 143,453 | 4.01 | 5,749.66 |
| Arizona | 5,136 | 202,106 | 5.04 | 10,195.97 |
| Colorado | 2,787 | 284,683 | 4.38 | 12,458.41 |
| Idaho | 6,566 | 105,271 | 2.74 | 2,888.55 |
| Montana | 4,254 | 100,063 | 2.84 | 2,845.81 |
| Nevada | 1,358 | 666,466 | 4.77 | 31,762.58 |
| New Mexico | 6,165 | 80,051 | 4.25 | 3,404.62 |
| Utah | 8,731 | 72,234 | 3.36 | 2,425.28 |
| Wyoming | 3,805 | 154,721 | 3.34 | 5,161.61 |
| Pacific Noncontiguous | 1,134 | 337,406 | 9.27 | 31,262.42 |
| Alaska | 473 | 148,649 | 7.32 | 10,876.50 |
| Hawaii | 661 | 472,477 | 9.70 | 45,850.23 |
| U.S. Total | 527,329 | 160,839 | 4.43 | 7,120.09 |
Commercial or industrial billings are generally determined by the level of demand and consumption of electricity rather than by consumer economic activity.
Average monthly consumption in kilowatthours is calculated by dividing the megawatthours by 12(months), dividing the results by the number of consumers, and multiplying by 1000(to convert to kilowatthours).
The average revenue is calculated by dividing the revenue by the megawatthours, then multiplying by 100 (to convert to dollars and cents).
The average monthly bill is calculated by dividing the revenue by 12(months), dividing the result by the number of consumers, and multiplying by 1000(to convert to dollars and cents).
 Note:
Note:
• Estimates are preliminary.
• The average revenue per kilowatthour of electricity sold is calculated by dividing revenue by sales.
• Values for average revenue per kilowatthour do not account for all energy service providers. Consequently, the growth in sales is underestimated (in particular for the commercial and industrial sectors). This, in turn, may affect the rates of associated revenue to sales of electricity.
Source: Energy Information Administration, Form EIA-826, “Monthly Electric Utility Sales and Revenue Report with State Distributions.”
kWh = Kilowatthour.
Related Pages:
Average Monthly Bill, 1999 Residential
Average Monthly Bill, 1999 Commercial
learn more on topics covered in the film
see the video
read the script
learn the songs
discussion forum