Some appropriate header and then an introduction goes here. Need also to check the Head and Meta statements, get text a good size, create good CSS styles, etc.
As will become apparent in the below, BPA does not want anyone to realize the truth of the matter. Is this a proper means of "marketing" from a government agency? That's a good question to ask oneself.
Hydropower resources provide unique system benefits to support system needs in the region
SPLIT THE FOLLOWING INTO APPROPRIATE, WELL-PLACED BITS.
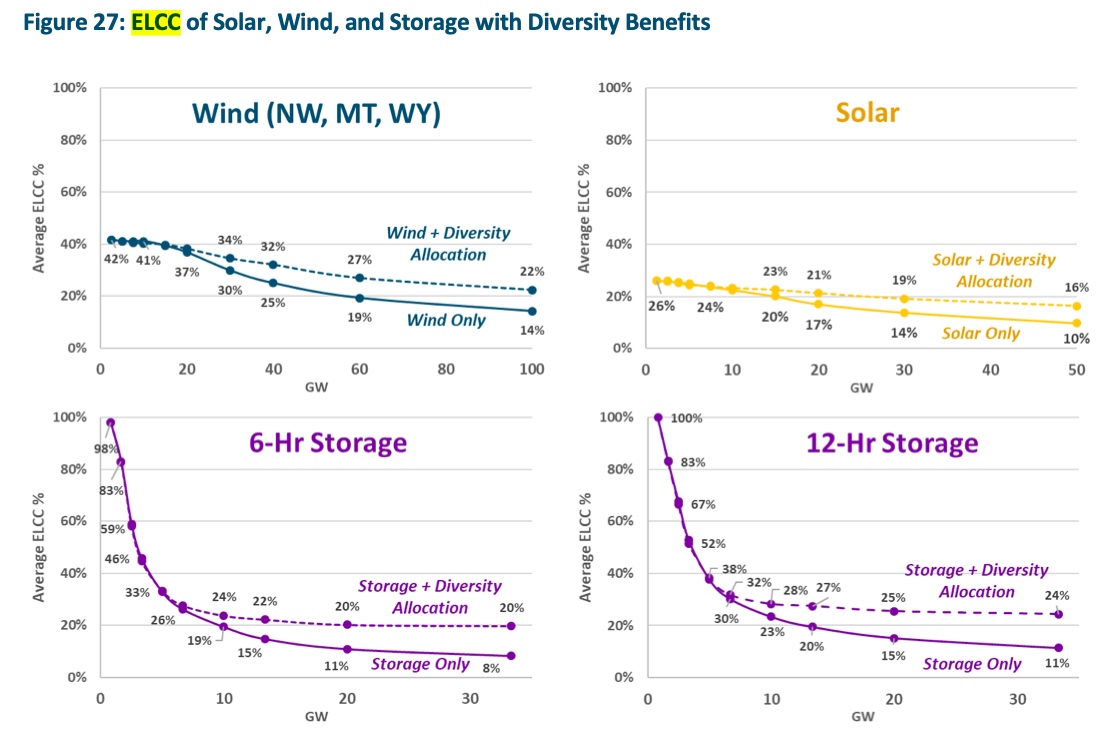
Whereas a Effective Load Carrying Capacity ("ELCC") for LSR dams is given a fixed number (initially 65% of 3,483MW), other resources see "saturation" effects as more and more of the same resource is added to the grid. This is much the same as the law of diminishing returns common in economic theory.
Notably, for both 6-hour and 12-hour storage, the ELCC curves drop steeply to below 10% after the first 3GW of storage are installed. A footnote describes the ELCC as being the "firm contribution to system peak load." In other words, additional storage will require a nameplate capacity of 10x it's actual need (e.g. 438aMW of LSR firm energy would require 4,380MW of battery storage). In the following, you will see that the experts from US Department of Energy ("DOE") took notice of this apparent oversight.
Oddly, E3's final presentation did not appear to take the DOE feedback to heart. BPA's chosen need to "market" hydropower was apparently a more necessary objective, and an honest objective study was not the end product for the general public to consume.
Storage has yet to arrive in the NW, yet E3's assume a steeply declining Storage ELCC curve due to satuartion effects. (get an exact quote). But when storage is replacing storage, it would be odd if an ELCC curve is necessary. Replacing like for like should be on a one-for-one basis. Would it not?
DOE experts further asked E3 to check the assumption that 3.4 GW of LSR hydro removed, (see page 23 of this PPT presentation file:///Users/scottlevy/Desktop/GOB_v_BPA/DraftFinalResults_May2022.pdf).
The experts likely assumed that their feedback would be taken to heart, in full, not merely the parts that were acceptable the Save Our Dams "stakeholders".
Stated another way, siting NW solar projects in the desert Southwest, storing the excess midday for demand peaks at sunrise and sunset (preferably near the demand centers, beyond transmission bottleneck locations), and the "High ELCC" curve would necessarily then apply.
For BPA's Executive Briefing, decisionmakers are reminded that storage shows "limited value in the Northwest with the large hydro fleet." But this is misleading and inappropriate for a LSR Replacement of Resource Study. It is precisely this incorrect assumption that leads to the critique published in Clearing-Up following the final report's release.
Replacement is not the same as addition.
The LSR dams storage benefit, if lost, would be replaced in a one-for-one fashion. The final analysis from E3, however, does not recognize this fact. Instead, the RESOLVE model downgrades the battery replacement resource as though it were not a replacement, but as an addition to a system with "saturation" of storage resources.
Mature Technologies
- . . .
- Storage resources support renewable integration but show limited value in the Northwest with the large hydro fleet.
- Demand response supports peak reduction but faces same ELCC decline as batteries;. . .
- . . .
- . . .
Show/Hide
-- Lower Snake River Dams Replacement Draft Results prepared for BPA Executive Meeting
April 27, 2022
 While BPA is looking for E3's report to confirm the CRSO EIS record of decision, E3 is provided a starting assumption much higher (2,284MW = 65% of 3,483MW Nameplate) than the CRSO EIS finding (1,120 for Multi-Objective 3 and only 760MW is attributable to LSR breaching). Why would BPA be overstating?
I just looked up our EIS result for MO3 (dam breaching and other measures). With least-cost replacements (combined cycle gas), we identified 1,120 MW need for 2022. Comparing that to S0, No policy, the E3 results have around 2,500 MW for 2035. That's a pretty dramatic difference...
Show/Hide
-- BPA email from Birgit Koehler to E3's Aaron Burdick, Arne Olson & BPA's Robert Diffely, Eve James
April 28, 2022, 11:45AM
While this is an outlier case -- not included in the final reporting -- an increase in energy exports from the region, is mentioned alongside "frequent over-supply conditions".
S2a1: Deep Decarbonization - Limited Tech w/ No New Combustion
Without new natural gas or H2 combustion turbines to meet growing resource adequacy needs, a large overbuild of onshore wind, offshore wind, and battery storage are selected
. . .
Exports from the region increase due to more frequent over-supply conditions, curtailment reaches -60% in 2045
Show/Hide
-- Lower Snake River Dams Replacement Draft Results prepared for BPA Executive Meeting
April 27, 2022
May 2022
Q. Why state 3.5 cents/kWh instead of $35/MWh?
A. Confusing the units makes it harder for the reader to understand the comparison that would otherwise be simple.
Current BPA Generation Rate 3.5 cents/kWh
. . .
LSR Dam all-in Generation costs (2022 $/MWh)
$13/MWh without LSRCP
$17/MWh with LSRCP
Show/Hide
-- BPA email from Eve James to Aaron Burdick
May 4, 2022 9:55AM
Three weeks after the April 15 report (above) comes the May 4 Draft Final Results and battery storage has decreased (slide 42).
S2: Deep Decarbonization (2035)
2.0 GW NG/H2 CCGT
0.1 GW li-ion battery (was 0.2 GW by 2035)
0.6 GW wind
S2: Deep Decarbonization (2045)
2.0 GW NG/H2 CCGT
0.3 GW li-ion battery (was 1.5 GW)
0.4 GW wind
0.05 GW energy efficiency
1.2 TWh H2 generation
. . .
E3's May 4 slide deck includes Additional LSR Dam Qualitative Benefits as requested by the initital contract with BPA (slides 48 - 52). When E3 informs BPA that these "qualitative benefits" are replacable (see bold text below and visit link to two PNNL reports, one YouTube video perhaps) subsequent slide decks drop the topic from the reporting.
Hydro is a Key Regional Source of Reactive Power (slide 48)
- . . .
- Most ancillary benefits can be provided by any turbine-based generation resource
- However, hydropower supplies benefits without the emissions cost of conventional thermal resources
- Hydropower is uniquely suited to overhead-dependent grid services like dynamic reactive power support
Hydro is a Key Regional Source of Reactive Power (slide 49)
- Hydropower operates with more headroom than conventional turbine-based resources
- PNW hydropower provides > 30% of reactive power in the WECC
- . . .
- . . .
- . . .
- Inverter-based renewables provide limited reactive power in the current system
- Hydro continues to be a key source of reactive power benefits even in low flow years
Voltage Ride-Through and Frequency Response (slide 50)
- Hydro generators are uniquely tolerant of high and low frequency events
- Conventional thermal turbines trip offline outside a narrow frequency range to avoid permanent damage to turbine blades
Inertia Buffers the Grid Against Instability (slide 51)
- NREL: "Inertia is derived from hundreds or thousands of generators that are synchronized, meaning they are all rotating in lock step at the same frequency"
- As the Pacific Northwest and other regions in the WECC pursue low-carbon electric systems, there may be many operating hours when conventional generating facilites that historically provided inertia are not online
- Inverter-based generation cannot inherently provide inertia, but may still be able to provide fast frequency response via grid forming inverters
- However, renewables are expected to reduce the need for inertia
- NREL researchers point out other design solutions, such as power electronics that increase the responsiveness of renewable generation, can be tapped to preserve system reliability in a low-inertia system.
Additional Grid Resilience Benefits (slide 52)
- Black start capability
- Participation in Remedial Action Schemes
- Short-Circuit and Grounding Contribution
Show/Hide
-- BPA Lower Snake River Dams Project Draft Final Results"
May 4, 2022
NOTE for SCOTT: I see an April 27 report at bottom of BPA E3 Study Records -- Third Release Part 1.pdf)
Until very recently, hydropower has been the primary source of electricity generation and energy storage. But installations of wind and solar, oftentimes coupled with battery storage, are the new kids on the block.
Hydropower dominates historical generation, followed by coal and natural gas
- Wind has grown but remains a small share of generation
- Solar has only very recently started to grow in its share of generation
Show/Hide
-- BPA Lower Snake River Dams Project: Draft Final Results
May 6, 2022
Adding to longstanding long-term contracts, newly created day-ahead, 1-hour and 15 minute markets have greatly improved reliability of the Western Electrical Coordinating Committee ("WECC") grid.
With these markets, BPA regularly purchases from the abundant supply of day time solar energy (from CA, NV, AZ, NW). Then as sunset arrives, hydropower is sold back through these same market mechanisms.
Utility IRP expectations of firm capacity in the form of market purchases pose reliability risks due to regional resource adequacy trends (slide 52)
Show/Hide
-- BPA email from Who to Whom
May 6, 2022
DOE-National Lab comments are expected May 18. Comments then follow.
these are looking at some of BPA's replies, so not merely the Comments so this should accompany that page, not this one
is misleading
35 year replacement timeline
overly dramatic and inconsistent.
seems somewhat offbase
in a one-sided fashion
most contentious relates... disagree on capacity of LSR
ELCC assumptions of the LSR dams, storage, wind, solar, etc are truly comparable.
low marginall ELCC of 12-hour storage
Avista assumes .. much higher than what E3 assumes
I am frustrated - BPA(?) comment to the comment
overly off-putting to regional stakeholders
Show/Hide
-- internal BPA email from Eve James to E3's Aaron Burdick & Arne Olson
May 12, 2002 7:18AM
"Finally, are such low ELCC values for storage, even 12-hour storage, consistent with the 65% ELCC assumption made for the LSR dams?"
"opportunity for imports and exports of all electricity services"
"The capacity credit of storage seems to be substantially lower than what has been calculated in other regions, particularly for the 12 - hr storage duration, after the first few GW of storage is deployed."
Note that some of this feedback, if addressed, would require substantive new work, and time. This is especially true for our comments on the scenarios, and on ELCC treatment and assumptions. We encourage discussions in the near term to determine whether and how to address those comments.
. . .
ELCC Values and Influence on Overall Results Deserve Attention: The capacity credit assumptions and results are likely extremely important in estimating the costs of having to replace the LSR dams' grid benefits.
. . .
- Cost Reporting: Can the fraction of the 'cost of LSR replacement' that comes from capacity needs be calculated? Based on the low raw LCOE costs of wind and solar, it seems logical that the capacity credit costs might make up half or even more of the total cost. If true, then all capacity-credit related assumptions and results are extremely important.
- Capacity Credit of LSR Dams Should be Investigated, and Possibly Revised: The analysis assumes that the LSR dams have, in effect, a 65% ELCC and so a resource adequacy value of 2.2 GW. Since the estimated replacement costs is driven in large measure by resource adequacy, confidence is needed on the capacity credit assigned to the LSR dams. As well, given the importance of resource adequacy to the analysis, it is important that ELCC estimates employed for the LSR dams use similar methods to those used for other resources. Some advocates in the Northwest have presented data and analysis suggesting that a much lower capacity credit is warranted, maybe half that assumed in the E3 study, see: Addressing-the-LSR-Peaking-Capacity.pdf (nwenergy.org). DOE has not independently assessed the linked paper, or the capacity credit of the Lower Snake River dams. But given the critical nature of this single input parameter, we recommend that E3 evaluate the linked paper and LSR output data during periods of system stress to either validate or revise the assumed 65% capacity credit. If a proper ELCC-type study for these facilities has not been conducted, then a review of historical output during periods of peak historical winter and summer (net) load could be used as an approximation. Under the decarbonization scenarios, a focus on the winter period or maybe the early fall (lower PV, so potentially high net load) may be relevant. Overall, more work is needed to validate these assumptions.
- Storage ELCC: The capacity credit of storage seems to be substantially lower than what has been calculated in other regions, particularly for the 12 - hr storage duration, after the first few GW of storage is deployed. We did not review the referenced study, but details on how these assumptions were created would be important within this slide deck. Information that would be helpful would include: (1) What does the winter peak look like? (time of day, duration, etc.); (2) What do resource profiles look like on that day, such that a combination of wind, solar, and 12-hour storage cannot contribute significantly? (3) Are interactions between wind, solar, and storage considered at all? (4) Are the scenarios in the referenced study similar enough to the scenarios in the LSR study to apply the same parameterization? Finally, are such low ELCC values for storage, even 12-hour storage, consistent with the 65% ELCC assumption made for the LSR dams?
- . . .
- Transmission Representation: Are the system-wide benefits of transmission (assumed to be needed for out of region wind and solar) considered? Is there any assumed resource adequacy contribution from this transmission, which could be provided from external "clean firm" resources? Also unclear more broadly how opportunity for imports and exports of all electricity services (energy, capacity, ancillary services) are being treated.
Show/Hide
-- BPA email from Who to Whom
circa May 18, 2022, (undated)
BPA's Environmental Communications Team shows frustration that E3 is not holding to, becoming suspect of, the overstated value of the LSR hydropower. Apparently, the Communication Team has yet to understand that reliability issues arise when power is scarce, not when it is plentiful.
As for the ELCC of the lower Snake projects, it is a little frustrating to hear them ask if the max capacity isn't just 1,000 MW like NWEC says. We have data to show that the peak capacity in the winter can be over 2,000 MW. (The average generation is 1,000 MW, so the peak will be higher anyhow.)
Show/Hide
-- BPA email from Birgit Koehler to Eve James along with E3's Arne Olson & Aaron Burdick
May 19, 2022 12:21PM
By mid-May 2022, peer review from Department of Energy ("DOE") and the White House Council on Environmental Quality had called into question the ELCC assumptions. The details of their concern are unpublished but it is seems likely they were directed at the oddly shaped ELCC curve for Energy Storage. Afterall, it sort of jumps out at you that Energy Storage looks so much different than ELCC curves for Solar and Wind.
This is also in the file called FrustratingAskIfMaxCapacity1000MW, a 12(?) page document
so maybe should be linking it instead, with several quotes from it.
e.g. I agree they don't point to any clear flaws, but they do point to key assumptions that drive the results but have a lot of uncertainty.
The 65% ELCC assumption we make is a clear driver of results, driven by the capacity need replacement. We're digging into some past work and the 2001 LSR output data provided by BPA to do some gut checks on that value. At the least, I could see us running a lower firm capacity % sensitivity as we discussed awhile back. We'll have a better opinion on a recommended approach once we've dug into that data a bit more.
next is the (R)egarding the comments.... (alredy included below)
(R)egarding the comments about ELCC assumptions, I can't tell if those are important to address or just note the source or logic behind the assumption ...
Show/Hide
-- Draft Final Report
May 19, 2022
Oh boy. Non-technical clearly is not E3's strong suit.
Show/Hide
-- internal BPA email from Birgit Koehler to Kathryn Pruder Scruggs, Eve James & VP Fish & Wildlife Scott Armentrout
May 20, 2022 4:38 PM
With these markets, BPA regularly purchases from the abundant supply of day time solar energy (from CA, NV, AZ, NW). Then as sunset arrives, hydropower is sold back through these same market mechanisms.
(perhaps) Mention that according to the CRSO EIS findings, sale price should be above cost of production it that is to 'sound business practices". For LSR dams, that sale price would thereby need to be ~$54/MWh, seldom achieved, and typically sold at a lower price, at a loss.
During average or high water years, Bonneville sells the surplus on the secondary market to help keep public power rates low.
Show/Hide
-- slide
May 20, 2022 4:38 PM
The text of the "High ELCC" (page 41 of Final Report) finding downplays the result, stating that the savings is "relatively small". When one considers the LSR dams represent less than 2% of the future grid, and their removal has a 2% benefit, then one notices the savings are commensurate with their size.
BPA's "Environmental Communications" team was on task to show that LSR power replacement with wind and solar would cover large tracts of land.
Can we make a map like this?
. . .
Katie is working to improve the E3 non-technical version of the ppt. We're hoping to get that done very quickly because it is urgent that we get back to CEO and DOE as quickly as possible.
In fact, we should discuss with E3 (and amongst ourselves) if we are far enough along that we can schedule that meeting. Many people would be happy if we could do it next week.
Show/Hide
-- Internal BPA email from Kathryn Pruder Scruggs (Environmental Communications Specialist) to Robert Diffely
May 23, 2022
BPA's Environmental Communication Team has yet to understand that reliability issues arise when power generation is scarce, not when it is plentiful. Maybe they do not understand E3 is to perform a Reliability Assessment, not just another BPA propaganda campaign (e.g. extolling benefits of a 3,458MW engine that seldom has the fuel to produce anywhere near that amount of energy).
I'm not quite sure what to make of the E3 slides that show that replacement resources are less MW than the 3,500 MW of the LSN. Maybe it's OK, because we can still say that it seems odd to get rid of perfectly good generation.
Show/Hide
-- internal BPA email from Birgit Koehler to Eve James & Kathryn Pruder Scruggs
May 23, 2022 7:53 AM
Some discussion goes here.
discussion here
Bottom line, we are suddenly under extreme pressure to get this done.
Show/Hide
-- internal BPA email from Birgit Koehler to Kathyrn Pruder Scruggs
May 23, 2022 3:15PM
E3's model, reveals a path towards "Deep Decarbonization" combined with salmon recovery would bring the removal LSR dams as soon as possible. Confusingly, their draft verbiage suggests those two are in conflict -- as BPA aims for the public to believe -- but E3's model proves the two are complementary.
With bluefish digging into 3,700 pages of BPA's FOIA-exempt deliberative documents (uncovered thanks to a lawsuit brought to Federal Courts by the Great Old Broads for the Wilderness) the public gets an important behind the scences look at BPA's shenanigans.
BPA Independence is suspect from the get go.
Note the document title "Bottom-Line Up Front" (is pun intended?).
Doug Johnson is introduced as being "very good at messaging most of our LSR dam capability public reports."
I received from feedback that the "Bottom-Line Up Front" and Conclusion slides need some more work
. . .
Attached are some "notes" for you to consider in the presentation. You can copy and paste into your template slides for the suggestions you like- feel free to edit and reword as needed. lam also sending a copy to Doug in our communications staff to see if he has any additional thoughts or comments since he is very good at messaging most of our lower Snake River dam capability public reports.
Show/Hide
-- BPA email from Eve James to E3's Aaron Burdick & Arne Olson
May 25, 2022, 8:46AM
Sparing Idaho's salmon of near certain extinction AND lowering BPA customer's cost at the same time is the solution: Remove LSR dams is E3's finding, and that is also what the CRSO EIS process found.
BPA's "Bottom Line" objective must therefore be to obfuscate the reality: Bury the fact that LSR dam removal is fast, cheap and easy.
This policy issue is looking for numbers: How much? How long?
Yes there are details, but put those after. So if you are looking
for how much -- its buried, or too complex.
And "How long?" is not in there specifically.
Show/Hide
-- Skype transcript of VP Fish & Wildlife Scott Armentrout
May 25, 2022
Some discussion goes here.
We can also plug in a couple of bullets from our news releases about the LSRD contribution to keeping the lights on during the cold snap and severe weather in winter 2021 and the June 2021 heat dome event.
Show/Hide
-- BPA email from Doug Johnson to BPA's Birgit Koehler & Eve James along with E3's Arne Olson & Aaron Burdick
May 25, 2022 9:06 AM
What are we losing?
- 3,483 MW of nameplate capacity, including more than 2,000MW of peaking capability to avoid power shortages during cold weather events.
. . .
(feedback re: 2,000MW of peaking capability) are exaggerating by only putting out the nameplate. Others are saying 1,000 -- we need to put our sustained capacity number up front to counter that narrative accurately
. . .
How long would it take to replace the services from breaching the lower Snake River dams?
- It would take up to a decade or more to bring new resources on-line once a decision to breach dams has been reached.
Show/Hide
-- BPA notes of feedback upon an early E3 slide deck
undated
State EXACTLY what we are replacing. It's not 2,000 aMW, it's 3,483 of nameplate capacity.
Show/Hide
-- internal BPA email from Kathryn Pruder Scruggs to Eve James, Birgit Koehler and VP Scott Armentrout
May 25, 2022
Something "Ugh" goes here
I know this is a tough project - but maybe not as tough as doing CRSO over again - ugh
Show/Hide
-- transcribed Skype of VP Scott Armentrout
May 25, 2022
Regardless of the contracted consultants' modeling results, the "bottom line" mission given to the BPA "Environmental Communication" team is that E3's study and modeling results must validate the CRSO EIS Record of Decision. That is the unenviable task assigned. How will that challenge be tackled?
... E3 results compare with the results in the CRSO EIS to show they wouldn't change our decision on the alternative that was selected. Jill thinks that is important to include in the materials.
Show/Hide
-- Internal BPA email from Eve James to Kathryn Pruder Scruggs and Birgit Koehler
May 27, 2022 7:30AM
Here is some draft language to consider for the "E3 analysis not changing the decision" key message for the E3 study PPT. (8AM)
. . .
Yes, I guess not changing the decision is the bottom line. I can help with writing the message for the slide, if you like. (7:30AM)
Show/Hide
-- Internal BPA email from Kathryn Pruder Scruggs (Environmental Communications Specialist) to Eve James and Birgit Koehler
May 27, 2022 7:30AM & 8AM
Troubling for BPA's "Environmental Communications" team, E3's modeling reveals a more reliable electrical grid that is less expensive when LSR dams are removed; and the sooner the better.
This aligns with the findings of the CRSO EIS that LSR dams are not economic, but the Record of Decision (of October 2022) oddly kept the LSR dams in place. Now, for BPA's "environmental Communications" team, the "Bottom Line" is for that Record of Decision to be substantiated when publicly released.
In keeping with our strategy of non - defensive objectivity, could we just in a matter of fact manner point out that the emerging technology scenario by definition relies on technologies that do not exist yet a scale and that the timing and availapility of those tecnnologies in the future is uncertain.
Or something like that -- pretty sure you had a good bullet on that somewhere already.
. . .
(on slide)
While it is conceivable to replace power beneftis of the lower Snake River dams, it is expensive, lengthy and complex.
Expensive
... $100 per year per househole without economy-wide decarbonization policies and with maturation of emerging technology or up to $850 per year for each public power household
Lengthy:
-- 15 to 30 years total for replacement resources -- it is unknown where replacement resources will be located and how much transmission infrastructure would be needed.
- Practically, likely 5 to 10 years for Congressional approval federal agency environmental compliance and Congressional appropriations
- Roughly 5 years to replace the capacity resources
- Realistically 15 to 20 years to build transmission, which includes providing compliance with the National Environmental Policy Act, siting, permits, etc., if no litigation on siting
Complex: ... Breaching the four lower Snake River dams significantly adds to this deficit of resources in the region.
Show/Hide
-- Internal BPA email from Benjamin Zelinsky to Birgit Koehler, Eve James & Kathryn Pruder Scruggs (Environmental Communications Specialist)
May 27, 2022 7:30AM & 8AM
The E3 Resolve model finds that under "Scenario 2a, Deep Decarbonization", LSR dam breaching provides a more reliable grid for 2% less than a grid that keeps LSR dams intact. (E3's "Deep Decarbonization" scenario requires that all electricity generated or imported from other regions emits no carbon emissions, and forsees sizeable demand increase due to the electrification of buildings, transportation, and industry )
Interestingly, E3's "Baseline" scenario also shows a cost savings of 2% when LSR dams are breached. Either way you go (E3 only reported these two results when assuming a "High ELCC" for battery storage), LSR dams are not providing "power benefits" but make a future power grid more expensive.. To the dam supporter's dismay, that is what the DOE-commissioned, "independent" study from E3 reveals (see page 41 of Final Report).
Years earliery, the CRSO EIS came to much the same conclusion, but the accompanying Record of Decision kept the dams intact, irrespectively. The task at hand for BPA's "Envrionmental Communications Team" is to repeat that maneuvering.
some discussion here
Updated deck is attached.
We noted 700-900 aMW for now on slide 3, pending any further data/guidance on this (though we've still modeled 706 aMW in our RESOLVE cases).
. . .
The average annual generation with the updated CRSO EIS assumptions on the LSN projects is 862 aMW for the 90 year streamflow set.
. . .
Some white book data I was looking at had the LSN gen -940 aMW but I want to make sure it has the correct spill operation.
. . .
...we could also just add a note that says 700-900 aMW* (* E3's RESOLVE model uses 2001, 2005, and 2011 hydro years, which resulted in ~700 aMW of lower snake river dams generation, making it a conservative estimate of the dams' GHG-free energy value).
. . .
We're nearing a second draft. Can we meet briefly after lunch to discuss how we've integrated the BPA feedback and confirm any open questions?
Show/Hide
-- E3 email from Aaron Burdick to BPA's Eve James & Birgit Koehler
May 27, 2022, 5:25PM
Then Birgit's husband realized that batteries could readily be a LSR power replacement, and that solution would occupy a mere 3 to 6 acres and online in 3 to 6 months. That's fast. And easy.
Using Megapack, Tesla can deploy an emissions-free 250 MW, 1 GWh power plant in less than three months on a three-acre footprint - four times faster than a traditional fossil fuel power plant of that size.
Show/Hide
-- from Birgit's Husband
not dated
June 2022
some discussion here
Joel Cook will be hugely pleased to see these high numbers in the powerpoint. Very cool!
. . .
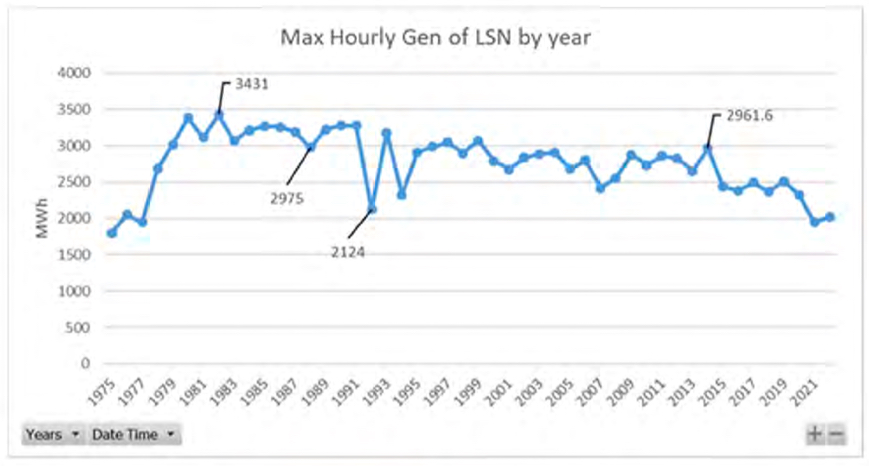
Interesting that these were all 1982. Clearly no spill, and some are 3 hours. We can find a way to say that we have generated over 3,400 MW somewhere in our presentations.
. . .
Maybe once fish operations happened on the projects so 1990 - 2021? I have some look back data that has a high value of 2955 MW
Show/Hide
-- BPA email from Who to Whom
May 31, 2022, 4:42PM
Some discussion goes here.
Some of the statements we had in our notes suggestions they weren't comfortable putting in since the study wasn't about that topic specifically and they want to keep the slides clean and independent from BPA messaging
Show/Hide
-- Transcript of Skype between Birgit Koehler and Eve James
May 31, 2022
In May 2022, Battery Storage may have been "Mature Technologies" though it was not selected.
Scenario 1: 100% Clean Retail Sales
- 100% of retail sales met with clean energy by 2045, ~85% carbon reduction
- Business-as-usual load growth
- Can be achieved using existing mature technologies
Scenario 2: Deep Decarbonization
- Zero carbon emissions remain in 2045
- High electrification load growth consistent with economy-wide carbon abatement scenarios.
- Emerging technologies are key to meeting higher winter reliability needs with carbon-free power
. . .
Replacing the Lower Snake River Dams
Scenario 1: 100% Clean Retail Sales
- Capacity replaced with dual fuel natural gas + hydrogen turbines
- Energy replaced by wind and net imports
Replacing the Lower Snake River Dams
Scenario 2: Deep Decarbonization
- Capacity replaced with dual fuel natural gas + hydrogen turbines
- Energy replaced by wind and net imports
Show/Hide
-- BPA Lower Snake River Dams Project Draft Final Results
May 2022
Using Megapack, Tesla can deploy an emissions-free 250 MW, 1 GWh power plant in less than three months on a three-acre footprint -- four times faster than a traditional fossil fuel power plant of that size.
-- Note from Mark, possibly Birgit's husband
May 23, 2022 10:26 AM
Show/Hide
Maybe not overlay on the LSN reservoirs, because they are a large area themselves.
-- BPA internal email, Birgit Koehler to Kathryn Pruder Scruggs
Subject: RE: can we make a map like this?
May 23, 2022 10:26 AM
Show/Hide
Maybe include the bit that technical language, is non-layman, and slips by the gatekeeper.
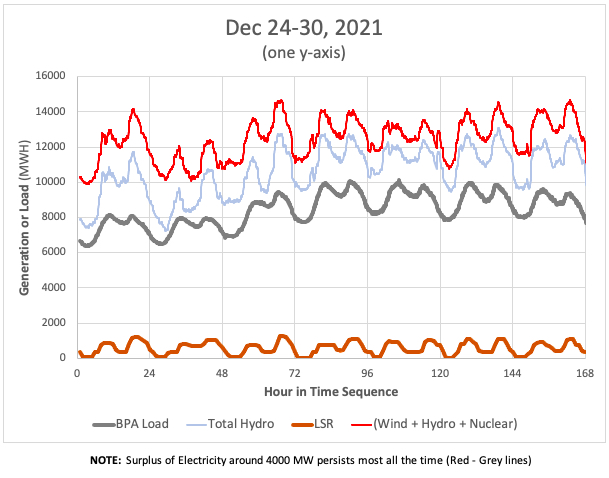
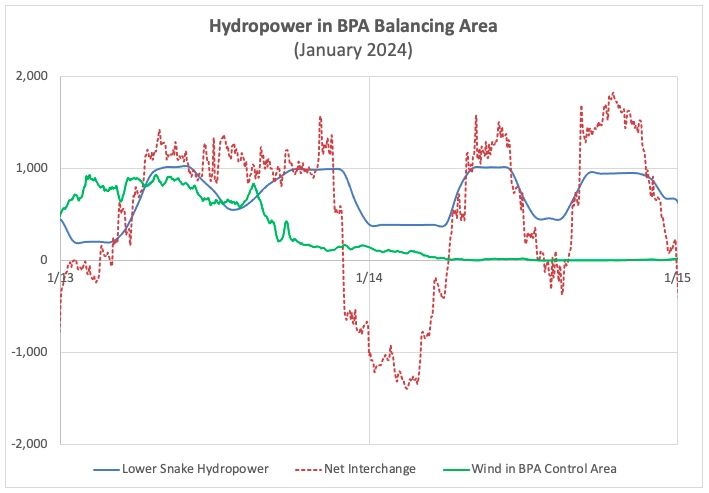
During the December 2021 'Cold Snap', the Northwest was exporting 3000 to 4000 MW every hour of the day, December 24-30, while Lower Snake River was providing around one-quarter of this energy surplus.
We can also plug in a couple of bullets from our news releases about the LSRD contribution to keeping the lights on during the cold snap and severe weather in winter 2021 and the June 2021 heat dome event.
Show/Hide
-- BPA email from Doug Johnson to Eve James and E3's Aaron Burdick & Arne Olsen
May 25, 2022
Within the BPA executive suite, it has been a long-held assertion that the four LSR dams provide a benefit to the electric grid worthy of their cost. But model after model fails to support that false claim,
and each and every "Executive Summary" strives to hide that very fact.
In the opinion of bluefish, BPA executives have long been less-than-honest in reporting LSR power benefits, and this has unpacks a raft of supporting evidence.
Consider BPA's interpretation of its foundational legal directive; to "market this power in such a manner as to encourage the most widespread use thereof at the lowest possible rates to consumers consistent with sound business principles". Are they complying with their mandate? How does this depend on the meaning of "market"? Tobacco companies being emblematic.
More to the point, is everyone in BPA's executive suite always in full agreement on interpreting their foundational legal directive?
Revealing is a transcribed Skype (5/25/22) wherein Vice President Fish and Wildlife, Scott Armentrout, makes a proposal to BPA Executives. Shouldn't there exist a trigger to inform leadership as to when a hydropower project (e.g. salmon-killing LSR dams) is worth the cost or not. Fish mitigation costs on LSR projects are exorbitant, and this thereby is reasonable proposal to consider.
Recently in the news, "public power" has been seeking to be relieved of the economic burden placed upon them by high-cost federal dams in Willamette Valley, Oregon. A similar argument could be laid upon the LSR projects. Importantly, both sets of dams were Congressionally authorized for purpose of "commercial navigation" (check that SCOTT, logs I recall), with hydropower production playing an auxilary, seconday role.
With their "commerical navigation" declining over the years, and maintenance costs remaining high, at some point their obsolescence is assured. Is it not? The "power benefits" then become important metrics for decision makers to consider.
Early in the E3 study process, VP Armentrout asks for such a trigger; what would tip the scale towards river restoration and dam breaching? BPA's VP of Fish & Wildlife deserves such an answer.
I heard (P)ower (a division of BPA separate from Transmission) say that power generation at the Willamette's was no longer beneficial at a certain number. ... While not relevant with this E3 study, it is a concept I still think leadership could use -- what are we watching for as triggers to make a conclusion that a cost is worth it or not worth it.
Show/Hide
-- Skype transcript of Scott Armentrout relayed by Birgit Koehler to Kathryn Pruder Scruggs (Environmental Communications Specialist) and Eve James,
May 25, 2022 9:49AM
In searching through the available record, it seems that no reply was then provided to BPA's VP Armentrout. To ask leadership for some preset condition from which "to make a conclusion that a cost is worth it or not worth it" is reasonable, especially when coming from the Vice President of Fish and Wildlife. As well, it seems to comply pefectly with the "sound business practices" that BPA is legal obliged to follow.
See also Tri-City Herald by Annette Cary
and
bluefish dueling with the CRSO EIS process in which nobody wins.
Something here.
Joel Cook will be hugely pleased to see these high numbers in the powerpoint. Very cool!
...
Thanks- could you look at the top hour from more recent data. Maybe once fish operations happened on the projects so 1990 -- 2021? I have some look back data that has a high value of 2955 MW- is there any data higher than that for that date range?
...
Interesting that these were all 1982. Clearly no spill, and some are 3 hours. We can find a way to say that we have generated over 3,400 MW somewhere in our presentations.
...
No problem! Narrowing down the data to what we need is best!
The Max Hour Gen in 2014 (2962 MW) happened in the month of March, just as you suspected...
If only looking at months of Dec to Feb, here are the top 5 Max Hour gen for 2006 -- 2021:
Top 5 Single- hr Gen MWh
Jan - 2011 2838
Feb - 2015 2438
Feb - 2006 2419
Jan - 2006 2299
Feb - 2017 2299
Show/Hide
-- internal BPA emails between Birgit Koehler, Eve James, Steve Bellcoff, Esther Neuls & Ryan Egerdahl
May 31 - June 1, 2022
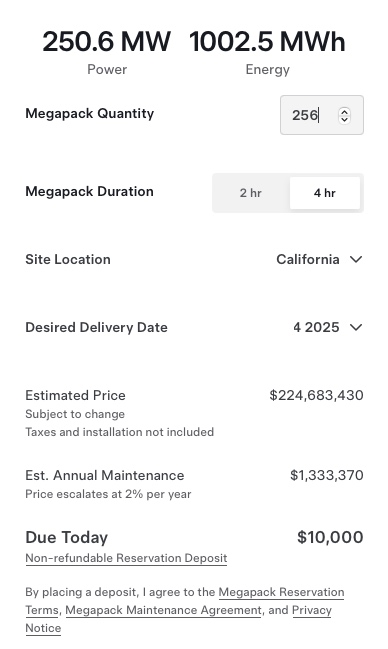
Tesla can deploy an emissions-free 250 MW, 1 GWh power plant in less than three months on a three-acre footprint ...
-- BPA internal email, Birgit Koehler to Robert Diffely, Subject: RE: can we make a map like this?
June 1, 2022 7:30 PM
Second slide already shows intended result of the E3 study, yet to be completed.
"Would conclusions in the E3 study change the decision for the Columbia Rivei System EnvironmentaLImpact Statement ?
No. In fact, the E3 study confirms the decision."
In these early slides, we are watching misinformation in development early in the "study".
- The Northwest Energy Coalition study incorrectly describes the capacity of the four lower Snake River dams as 1,000 MW, when in fact, the nameplate capacity is 3,483MW and sustained capacity is over 2,000 MW.
The region regularly calls upon more than 2,000 MW of sustained peaking capabilities, to avoid power shortages during the winter and has provided peak generation between 2,500 and 3,000 MW during late- winter/early-spring in the majority of the last 20 years
- Baseline for the NWEC study assumes that 300 MW of market purchases to provide firm
power.
While BPA sometimes purchases power to serve its customers, during times of high demand (winter cold snaps or summer heat events) there
often is riot enough power on the market, and other utilities may be declaring energy shortage emergencies.
- The NWEC study understates the benefits that the four lower Snake River dams provide in
terms of grid stability -- ancillary services such as generation reserves required to keep the
lights on.
In addition to providing sustained peaking capacity the lower Snake River dams provide generation reserves that can provide additional generation on short notice for grid stability and to integrate other intermittent resources such as wind and solar.
Show/Hide
-- internal BPA email from Eve James to Robert Diffely & Birgit Koehler
June 1, 2022, 11:01AM
Show/Hide
Nevertheless, recognizing that the capacity value of energy storage is still being researched, in the
Northwest and elsewhere, we include a sensitivity case in which energy storage resources are assumed
to have much higher ELCC values, similar to what is expected in the Southwest at comparable
penetrations.
-- E3 is still reviewing this case
and deciding whether to include or not.
-- Draft Final Report submitted to BPA for review
June 2022
Show/Hide
I asked my husband if he'd give it a try. He came up with 65 acres. So that doesn't register next to the wind and solar.
-- BPA internal email, Birgit Koehler to Robert Diffely
Subject: RE: can we make a map like this?
June 1, 2022 7:30 PM
Show/Hide
The "Northwest Core" is connected to the Southwest at all times of the day and year. That has been the case for decades now. Restricting the model from knowledge of this fact, that charging storage in the Northwest can come from the Southwest, is deception. Not only is the model being deceived, the public reading the results is also deceived.
To E3's credit, an appropriate ELCC curve was included in their report, where it is referred (page 41 Final Report) as a High ELCC curve for storage. How they got this past BPA's "Environmental Communications Team" is anyone's guess.
(W)e include a sensitivity case in which energy storage resources are assumed
to have much higher ELCC values, similar to what is expected in the Southwest at comparable
penetrations.
Show/Hide
-- Draft Final Report
June 2022
some discussion here
I base this on breaching requiring Congressional authorization - but it seems reasonable to me that Congressional action would take at least two sequenced actions.
Congress would have to authorize dam breaching, presumably in a Water Resource Development Act cycle - so at least two years.
Then you should assume how long it will take Corps to dp planning and design and the necessary NEPA process.
Then it will matter of getting appropriations. The Administration would presumably propose in the President's budget - that's a two year lead time, and then a year at minimum for initial appropriations.
. . .
I am concerned about appearing to exaggerate, ...
Show/Hide
-- internal BPA email from Douglas Marker to Birgit Koehler, Eve James & Kathryin Pruder Scruggs
June 1, 2022, 4:40PM
E3 money stuff
(W)e're getting tight on our budget after all the iteration on the public deck. We have about $15k left for drafting the word report, assuming no other tasks on the public materials, which is a bit tight vs. the $25k we originally had planned.
Show/Hide
-- E3 email from Aaron Burdick to BPA's Eve James & Birgit Koehler
June 2, 2022, 4:43PM
The best available information would recognize that battery storage are contenders for replacing the power benefits of the LSR hydropower projects.
Any consideration of dam breaching must be informed best available information on the objective costs associated with replacing the full capabilities of those dams, including:
- Peaking capabilities
- Transmission considerations
- Reliability (ability to keep the lights on)
- Land use
- Affordability for homes and businesses
(bluefish notes: battery storage is a top contender for all the above needs. Why would the E3 study not recognize that fact?)
. . .
I like the message about best available information. (I'm tempted to throw something in there about timing, but that's not going to be a deal breaker for those wanting to breach.)
(bluefish notes: It would appear that a central objective of messaging is to combat or thwart "those wanting to breach".)
Show/Hide
-- internal BPA email from Kathryn Pruder Scruggs to VP Fish & Wildlife Scott Armentrout, Birgit Koehler, Eve James & Benjamin Zelinsky
June 2, 2022 1:18 PM
Show/Hide
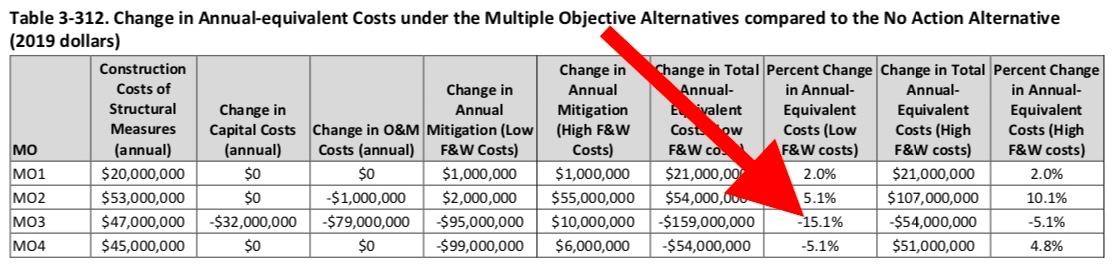
While BPA initial sought the replacement of 3,483 MW of LSR nameplate capacity, E3 recognized that reliability is determined not by the maximum power available, but by the generation capability during cold winter conditions and river flows are low.
Consequently, E3's RESOLVE model assumed 709 aMW was to be replaced when LSR dams are breached. A sensitivity analysis revealed that it is LSR dams' peaking abilities (Figure 19) that drove the final results, and this could readily be replaced by battery storage (though the Final Report makes no admission of that fact).
It also should be noted that despite BPA's repeated insistence, the LSR dams and reservoirs do not provide GHG-free energy (see PNNL & TellTheDamTruth). It seems that BPA would have the public believe that reservoirs are not necessary for the LSR dams to produce electricity, thereby allowing these misleading assertions that the LSR dams provide "GHG-free energy".
E3's existing RESOLVE model data uses historical hydro years 2001, 2005, and 2011 as representative of the long-term average low/mid/high hydro year conditions. However, for the LSR dams, this leads to a relatively low output of ~700 average MW, whereas the dams may generate -900 average MW on average across the full historical range of hydro conditions. Therefore, E3's analysis likely underestimates the energy value of the dams and costs for replacing that extra GHG-free energy.
Show/Hide
-- Draft Final Report
June 2022
Flywheels, ultra-capacitors and synchronous condensers are available technologies, currently used in many places, would readliy replace these "Additional LSR Dam Power System Benefits (not modeled)". In other words, there is nothing special about LSR dams that makes them "essential" to the Northwest power grid.
E3 notes that the LSR dams may provide the following additional essential reliability services to the transmission grid. In general, E3 expects that the replacement of these services can be achieved either through siting and operations of the incremental replacement capacity selected or by additionally (relatively small) local transmission investments.
...
(sidebar note) BPA - we propose deleting this appendix ...
Show/Hide
-- Draft Final Report
June 2022
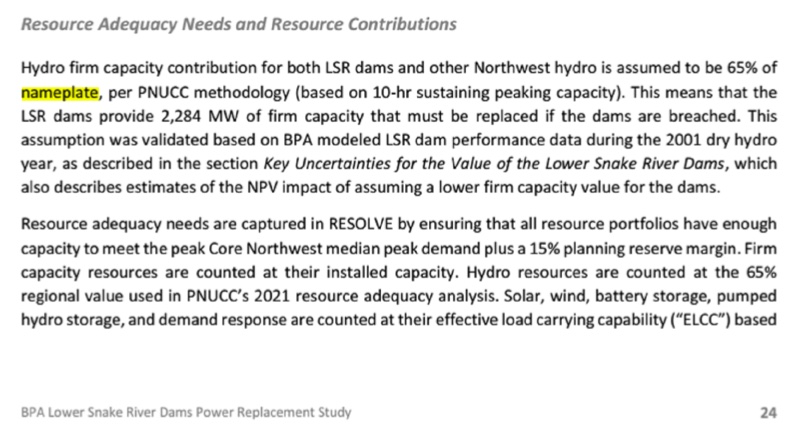
Solar, wind, battry storage, ... their effective load carrying capability ("ELCC") based on E3's RECAP modeling from its 2019 Resource Adequacy in the Pacific Northwest study.26 Figure 13 shows the initial capacity values for these resources, as well as the declining marginal contributions as more of the resource is added.
Draft Final Report
June 2022
Perhaps with suspicion, BPA's Vice President of Fish and Wildlife Scott Armentrout asks for citation to the "not fast, cheap or easy" contention. Turns out, that source document would be BPA's The Bottom Line: Bonneville perspective on E3 study.
... eliminate the "not cheap, fast or easy" language. If we are quoting some other study that said that, we should attibute it.
Show/Hide
-- internal BPA email from Scott Armentrout
to James Eve,
John Hairston (Administrator),
Joel Cook,
Suzanne Cooper,
William Leady Jr,
Birgit Koehler,
Jill Leary,
Mary Godwin,
Anne Senters,
Benjamin Zelinsky,
Leah Sullivan
June 6, 2022 7:10AM
Some discussion here
- 3,483 MW in maximum capacity
- histoncalty generation has peaked at 3,431 MW
- More than 2,000 MW of sustained peaking capabilities dunng cold winter weather events to avoid power shortages
- A quarter of Bonneville's current reserves holding capability wtuch is important for integrating variable generating resources such as wind and solar
- Essential grid reliability services and efficiency of power transmission (such as voltage supped, reactive power, inertia, black start, etc
AND on and ON, and On
Show/Hide
-- internal BPA email from Eve James to Birgit Koehler
June 9, 2022 4:35PM
some discussion here
DOE feedback is included on the PDF file
Thank you Aaron and Arne!
I think that went well. Was impressed by some of the questions and surprised by others. Quite probing.
(reply from Arne)
One thing I'm a little worried about is that we focused so much time on the resource adequacy value that we may have inadvertently given short shrift to the other values the dams provide. Perhaps BPA can emphasize that in the E3 results when you have your own debrief with them.
(DOE critique & discussion)
Not to be a stickler for detail but I looked up the LSR dams on the USACE website and they rate... For a total of 3,033MW not 3,483MW
. . .
Droughts tend to drive reliability challenges in the NW. During drought years there are extended energy shortfalls when energy storage would not have charging energy.
. . .
The nameplate capacity is wrong according to the USACE data. I believe it was mentioned that E3 makes their case during the peak river flows and not during the summer, when generation drops significantly and is needed because of air conditioning. Due to drought and other climate events, the hydro generation is becoming out of synch with actual needs in the northwest.
. . .
Replacement: What is not mentioned is end of life of the generating units or the dam. These were units installed in the mostly in the 70's and some in the 60's. Considering the renewable resource, perhaps the end of life should be considered as well.
. . .
A bit of misinformation here. They showed 50 square miles at Seattle. Perhaps the same perspective should be in the Lower Snake region itself. Likely this could be expanded or distributed and have greater gains than currently exist.
. . .
However, the variablity of the wind and solar had a strategy that includes energy storage which is not mentioned.
. . .
Rational decisionmaking must be considered here. This could be a planned transition based upon end of life, supply chain, or other considerations with a likewise development of replacement generation.
. . .
My largest concern regards messaging and, specifically, what I perceive to be an overly dramatized summary of analysis results. This is especially true in the BPA reflections deck, but also the E3 PPT.
...
There are a few other ways in which the results feel over-dramatized, and unnecessarily so:
...
Suggesting that lower costs are only achievable 'without decarbonization policies' is misleading.
...
Some of these times could be happening in parallel, rather than in sequence. While noting timelines is important, the current presentation feels overly dramatic and inconsistent.
...
But as above, under all of the realistic scenarios, the E3 analysis includes relatively little wind and solar and batteries. So the entire slide seems somewhat off- base, relative to the actual analysis.
...
It just feels that the analysis in places is being presented in a one-sided fashion, and not as neutrally as might be desired. It does not feel necessary to take this approach.
I anticipate that, beyond the items listed above, among the most contentious relates to the resource adequacy contribution of the LSR dams and possible replacement resources.
...
Meantime, we wonder whether the ELCC assumptions of the LSR dams, storage, wind, solar etc are truly comparable. Are all of these marginal ELCC values or are they all average values -- or are some average and some marginal? Why the relatively high ELCC of the LSR dams but the low marginal ELCC of 12-hour storage?
...
As for stakeholder engagement, I fear that the E3 results and BPA reflections will be overly off-putting to regional stakeholders -- not necessarily because of the analysis itself, but because of contention over a small number of core assumptions (e.g., ELCC) and how the results are presented (e.g., the high-cost outlier, noted above). I would encourage BPA to think seriously about how to present these results to regional and federal stakeholders in a way that improves understanding and dialogue.
. . .
(Topic of MONEY to E3)
I reached out to contracting and since the contract was set up as a firm fixed price changing the structure of the contract to a time and materials budget won't work. They are going to review the terms and scope and then set up a meeting where we can discuss what types of options could be used for additional meetings.
...
I just want to flag that we're already approaching our (expanded) budget and will likely need additional budget to cover these further slide updates and later public presentations.
Show/Hide
-- BPA email from Birgit Koehler to E3's Aaron Burdick & Arne Olson and BPA's Eve James
June 16, 2022, 9:50AM
some discussion here
(T)his is an independent study and we don't want people to associate BPA as a gatekeeper of the results.
. . .
Kurt Miller asked if we intend to brief the Murray- Inslee consultants on our E3 study findings,
Show/Hide
-- internal BPA email from Eve James to Director of Communications Joel Scruggs, Birgit Koehler & Senior Spokesperson Doug Johnson
June 17, 2022, 8:39AM
some discussion here
Hi Rob-
I forgot to mention that Birgit and I have been reviewing with a "light-touch" since this is an independent E3 study. Any red-flag important catches or corrections we've been commenting on.
. . .
I updated his response to your prior feedback (but did not track those changes).
. . .
Also, just so you are aware there is a discussion with some of DC folks tomorrow so I was going to wait and email the Council staff tomorrow after that meeting if you don't mind. If you have concerns about waiting to share materials please let me know.
Show/Hide
-- internal BPA email from Eve James to Robert Diffely & Birgit Koehler
June 19, 2022, 12:41PM
One might wonder why this table would state 3.5 cents/kWh when it would be equivalent to state $35/MWh and make the units correspond to the column immediately adjacent of LSR All-In Generation Costs.
Earlier this year, BPA engaged electric industry research firm Energy and Environmental Economics to build on the analysis performed in the Columbia River System Operations Environmental Impact Statement regarding replacement resources and costs associated with a scenario where the four lower Snake River dams may be breached in the future. BPA anticipates E3 's study to contribute to the regional dialogue about the future of these publicly-owned assets and help elevate regional understanding of the complexities and expenses involved in exploring replacement resources for the LSR dams.
- Breaching the dams would require resource builds just to get the system back to where it is now rather than replacing fossil fuel generation.
- Some of the lower-cost options for replacing lost hydro power rely on emerging technologies that are not yet developed or available large-scale.
- Replacing the dams with existing renewable technology would be prohibitively expensive.
- Replacement resources would result in higher electric bills for millions of NW residents.
- It could take up to 20 years to complete
With multiple reviews of the future of the lower Snake River dams being conducted by the Council on Environmental Quality, the Columbia Basin Collaborative and Senator Patty Murray (D-WA) and Washington Governor Inslee, BPA felt it necessary to update the potential costs of replacing these facilities.
The CRSO EIS analysis examined a series of resource replacement portfolios using the latest resource cost estimates to reflect reasonable replacement resource alternatives and associated costs. E3 will-include a resource portfolio optimizer model using their data sets and their criteria and objectives to create least cost replacement portfolios.
E3's analysis includes several scenarios for replacement resources, including some emerging technologies such as offshore-wind and gas plants with carbon capture that are not deployed yet. It also includes use of traditional renewable resources, such as wind, solar, and storage. All of the scenarios present moderate to significant upward rate pressure for BPA's customers.
. . .
2. What power benefits do the four LSRDs currently provide?
These facilities first and foremost provide reliable electricity to help the western interconnection and the Pacific Northwest avoid blackouts. The LSRD also provide carbon-free energy to help fight climate changes.
More specifically, they are capable of providing a short-term peaking capacity of more than 3,000 MWs. The LSRD can provide more than 2,000 MW of longer term peaking capacity during cold snaps when Pacific Northwest electricity use is at its highest. The LSRDs also provide important reserves and essential grid reliability services, including voltage support, reactive power and black start ability.
. . .
Scenario 2a: Deep Decarbonization (Baseline Technologies)
2.0 GW dual fuel NG/H2 CCGT
0.3 GW li-ion battery
0.4 GW wind
0.05 GW advanced energy efficiency
addtional H2 generation
Firm capacity is mostly replaced with ~2 GW of dual fuel natural gas + hydrogen turbines. These turbines may initially burn natural gas when needed during reliability challenged periods, but would transition to hydrogen by 2045 to reach zero-emissions.
Show/Hide
-- BPA Talking Points: E3 lower Snake River dam replacement costs analysis
June 24, 2022
some discussion here
The basic concern during the discussion was that the study is independent and we don't want to be viewed as putting a spin on it or interfering with others viewing the study as independent . . .
Show/Hide
-- internal BPA email from Eve James to Doug Johnson & Birgit Koehler
June 28, 2022, 8:47AM
some discussion here
Basically our communications would set up a conference line where any press outlet could call and ask questions about the report or presentation from the Council meeting. We would defer to you for any of the analytical questions and then BPA would cover any questions related to CRSO EIS, future consequences on FCRPS, etc..
. . .
Murray's office would like an E3 results briefing July 8. ... There is also a broader NW Congressional briefing that may be scheduled with staff still working around the availability you mentioned. . . since they wanted a separate briefing.
. . .
I just heard from our DC relations staff that Congressional staff would prefer their own briefing of the E3 results.
Show/Hide
-- BPA email from Eve James to E3's Arne Olson, Aaron Burdick & BPA's Birgit Koehler
June 29, 2022, 1:16PM
The LSR dams are fifty years old, and turbines are in need of replacement. Ice Harbor, the oldest of the LSR projects, replaced three turbines for a cost ~150million, twice the accepted contract price. "We typically used a 50-year NPV analysis for hydro projects."
50 years seems most consistent with other analysis. Ultimately, it should be tied to the useful life of the LSR dams. If storage assets have 10 year useful, and LSR dams are expected to last 50 years, then full modelling would include 5 tranches of battery additions.
. . .
We typically used a 50-year NPV analysis for hydro projects. I don't think that there is a comparable number in the EIS. The Corps presented the differences in scenarios in terms of average annual costs. I can't remember there being NPVs anywhere that compared the expected future value of generation and project costs with and without the LSRDs.
Show/Hide
-- internal BPA email from Peter Stiffler to Gordon Ashby, Robert Diffely, Alexander Lennox, Eve James & Birgit Koehler
June 30, 2022, 2:23PM
To hide what needs be buried, a distraction is created. A fake model result is created as a stand-in, easily made by giving the model unreasonable input assumptions. Unfortunately in our modern world, this is a well trodden path.
By assuming that batteries can only be charged from within the NW Core, the model is made unaware of imports/exports from other regions that could charge batteries when NW Core renewables are not generating (e.g. regional "Cold Snaps" that are accompanied by low wind).
(T)here does not seem to be a discussion that directly addresses imports/exports between the regions- there may be questions.
Show/Hide
-- BPA email from Eve James to E3's Arne Olson & Aaron Burdick
June 30, 2022, 5:35PM
Unfortunate for the shape shifters, E3 had recently completed a well-publicized Resource Adequacy in the Pacific Northwest report employing reasonable ELCC curves for battery storage, of both 4- and 12-hour duration.
 Note that ELCC of "battery storage" in Figure 13 (below) does not correspond to the ELCC "from 2019 Resource Adequacy in the Pacific Northwest study" (above) as promised.
E3 excuses itself, by arguing that "saturation" is "particularly acute in the Pacific Northwest". Acting as though their are no transmission lines connecting all the Western States, a steeply dropping ELCC curve is promoted because "a significant quantity of energy storage implicit with the 35-GW hydrosystem in the region".
But if it is a piece of this hydrosystem that is being replaced, storage would be a one-for-one exchange. The "saturation" argument is a nonstarter: Replacement of energy storage is not "additional energy storage".
Significant quantities of energy are stored in hydroelectric reservoirs today and dispatched when needed to meet peak loads. Thus, additional energy storage has less value for providing resource adequacy in the Northwest than it does in regions that have little or no energy storage today.
Show/Hide
-- BPA email from Eve James to E3's Arne Olson & Aaron Burdick
June 30, 2022, 5:35PM
 By assuming that batteries can only be charged from within the NW Core, the model is made unaware of imports/exports from other regions that could charge batteries win NW Core renewables are not generating (e.g. Cold Snaps accompanied by low wind).
(T)here does not seem to be a discussion that directly addresses imports/exports between the regions- there may be questions.
Show/Hide
-- BPA email from Eve James to E3's Arne Olson & Aaron Burdick
June 30, 2022, 5:35PM
Something here.
Good morning Arne (or just now afternoon on the east coast),
We had a huddle this morning with our administrator, and he suggested that it would be a good idea for me to fill you in a little bit about what's been going on. I'm glad that I finally have the OK to do that.
The short explanation is that CEQ is nervous about the report and alarmed at the high costs, particularly the NPV of scenario 2c. CEQ is also asking a lot of unusual technical questions, but I am trying to field them. DOE has been advocating for us, and the decision on whether to hold or proceed despite CEQ went all the way up to the Secretary of Energy last evening.
Show/Hide
-- Smothing HERE
June 2022
Department of Energy (DOE) that contracted the independent study from E3, hosted a "peer review" that questioned the E3's "Saturated" ELCC curve for Storage. As the Final Report was nearing completion, these concerns had not been addressed (until page 41 when "High ELCC" input assumptions were discussed).
The capacity value of energy storage resources shown in Figure 13 are very different from those in other regions, such as California or the Desert Southwest, declining much more steeply as a function of penetration.
Show/Hide
-- Draft Final Report
June 2022
seems like page 2 should follow the other Figure 13 page
